Fund Transfer Patterns Among Regular Multi-Venue Participants in Gaming Activities
Regular participants in gaming activities often shift funds between physical casinos, racetracks, sportsbooks, and digital platforms, creating observable sequences that regulatory bodies and financial analysts track through transaction records. Data from multiple jurisdictions reveal that these movements follow recurring schedules tied to event calendars, account balances, and promotional windows, with transfers clustering around major sporting fixtures and seasonal promotions. Observers note that participants who engage across venues tend to use a narrow set of payment rails repeatedly, which simplifies reconciliation for operators while generating clear longitudinal footprints.
Timing and Volume Trends in Multi-Site Transfers
Records compiled by state-level regulators in the United States indicate that transfer activity among frequent users spikes in the days immediately preceding major competitions, while smaller routine movements occur mid-week to maintain liquidity across accounts. Figures from the Nevada Gaming Control Board show average transfer sizes ranging between 250 and 1,800 USD for individuals logging activity at three or more venues within a 30-day window, with the highest concentrations appearing on Thursdays and Fridays. Researchers examining similar datasets in Australia have documented parallel patterns, noting that weekend transfers often exceed weekday volumes by 35 to 60 percent when horse racing and football schedules overlap.
June 2026 brought additional visibility to these rhythms because several international tournaments aligned with the end of fiscal quarters for many operators, prompting a measurable uptick in cross-border e-wallet movements. Participants who maintained balances at both land-based and remote sites executed bridging transfers more frequently during this period, according to aggregated settlement reports shared among payment processors.
Preferred Methods and Routing Sequences
Analysis of transaction logs demonstrates that frequent participants rarely rely on a single method for every venue, instead rotating between bank wires, prepaid cards, and licensed e-wallets depending on fee structures and settlement speeds. One documented sequence involves an initial deposit via credit card at an online sportsbook, followed by a same-day withdrawal to an e-wallet and subsequent transfer to a casino cage for table play. Such chains reduce exposure to single-platform limits while preserving audit trails that operators must retain under anti-money-laundering statutes.
Geographic and Platform Variations
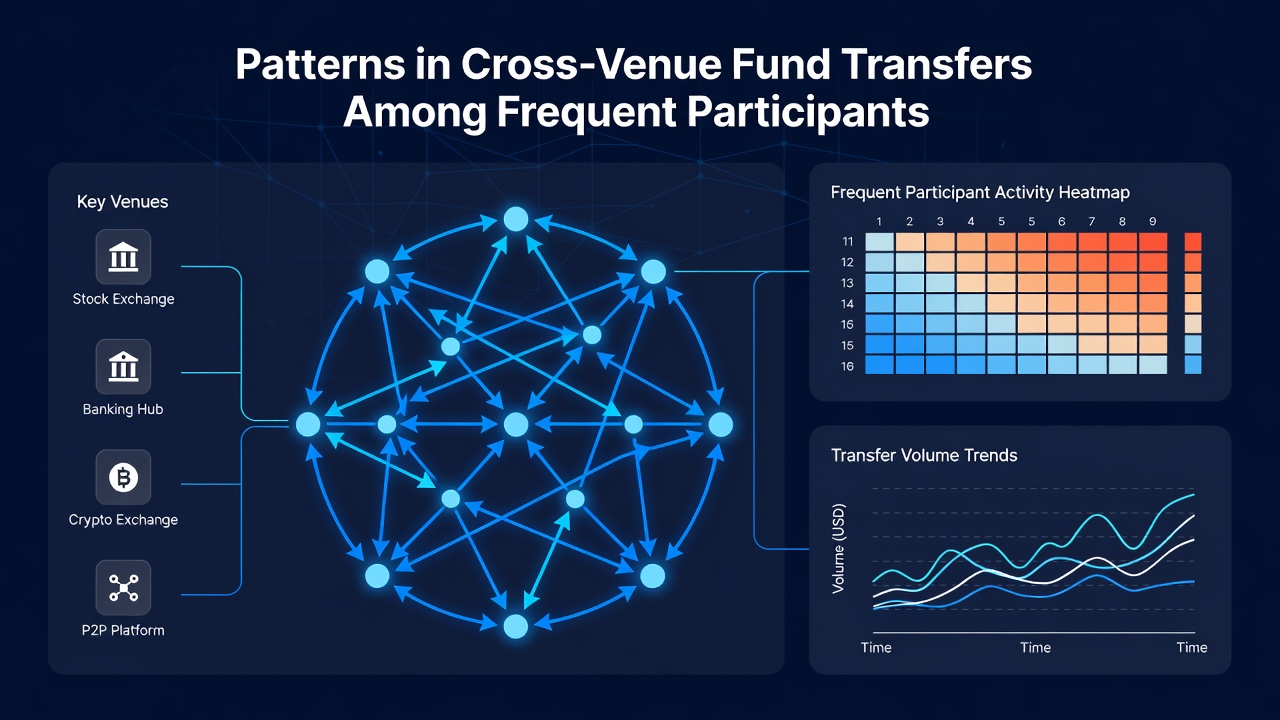
European operators report higher reliance on instant bank transfers for domestic movements, whereas North American data highlight greater use of player loyalty accounts that allow internal sweeps between affiliated properties. Canadian provincial reports similarly note that participants crossing provincial lines favor cryptocurrency rails for speed, although regulated fiat channels still account for the majority of documented volume. These differences produce distinct network graphs when visualized, with nodes representing venues and edges weighted by transfer frequency.
Behavioral Indicators and Risk Markers
Financial intelligence units have identified clusters where rapid back-and-forth movements between venues coincide with sudden changes in betting volume, prompting enhanced due-diligence reviews. Studies published by academic teams at institutions such as the University of Melbourne link these patterns to both legitimate bankroll management and, in a smaller subset of cases, attempts to obscure source of funds. The presence of consistent timing intervals, identical transfer amounts, and repeated use of the same intermediary accounts serves as a practical filter for compliance teams seeking to prioritize cases.
Payment processors servicing multiple operators have begun sharing anonymized pattern libraries that flag sequences occurring more than four times per calendar month. These libraries draw on data contributed by venues in several countries, allowing earlier detection of coordinated activity across borders without requiring individual participant identification at the initial screening stage.
Regulatory Reporting Requirements and Data Sharing
Jurisdictions that license multi-venue operations now mandate periodic submission of aggregated transfer statistics, enabling cross-comparison between regions. Reports submitted to authorities in New Jersey and Pennsylvania, for example, must include breakdowns by payment type and participant frequency tier, while Australian state regulators require supplementary narrative describing any observed deviations from baseline patterns. Such standardized disclosures facilitate benchmarking across markets and support the development of shared typologies used by investigators.
Industry associations including the World Lottery Association have circulated guidance documents that encourage operators to map internal fund flows against publicly available event calendars, thereby aligning monitoring thresholds with predictable demand surges rather than applying uniform static rules. This approach reduces false positives while preserving resources for higher-risk sequences.
Conclusion
Patterns in cross-venue fund transfers among frequent participants continue to evolve alongside regulatory frameworks, payment technology, and the global sporting calendar. Comprehensive datasets assembled by oversight bodies and academic researchers supply the factual foundation for identifying recurring sequences, preferred routing methods, and volume fluctuations that characterize these movements. Continued refinement of reporting standards and inter-jurisdictional data exchange supports more precise monitoring without restricting legitimate liquidity management by regular users.