Drift Detection: Tracking Line Movements to Sharpen Sports Betting Edges
Drift Detection: Tracking Line Movements to Sharpen Sports Betting Edges
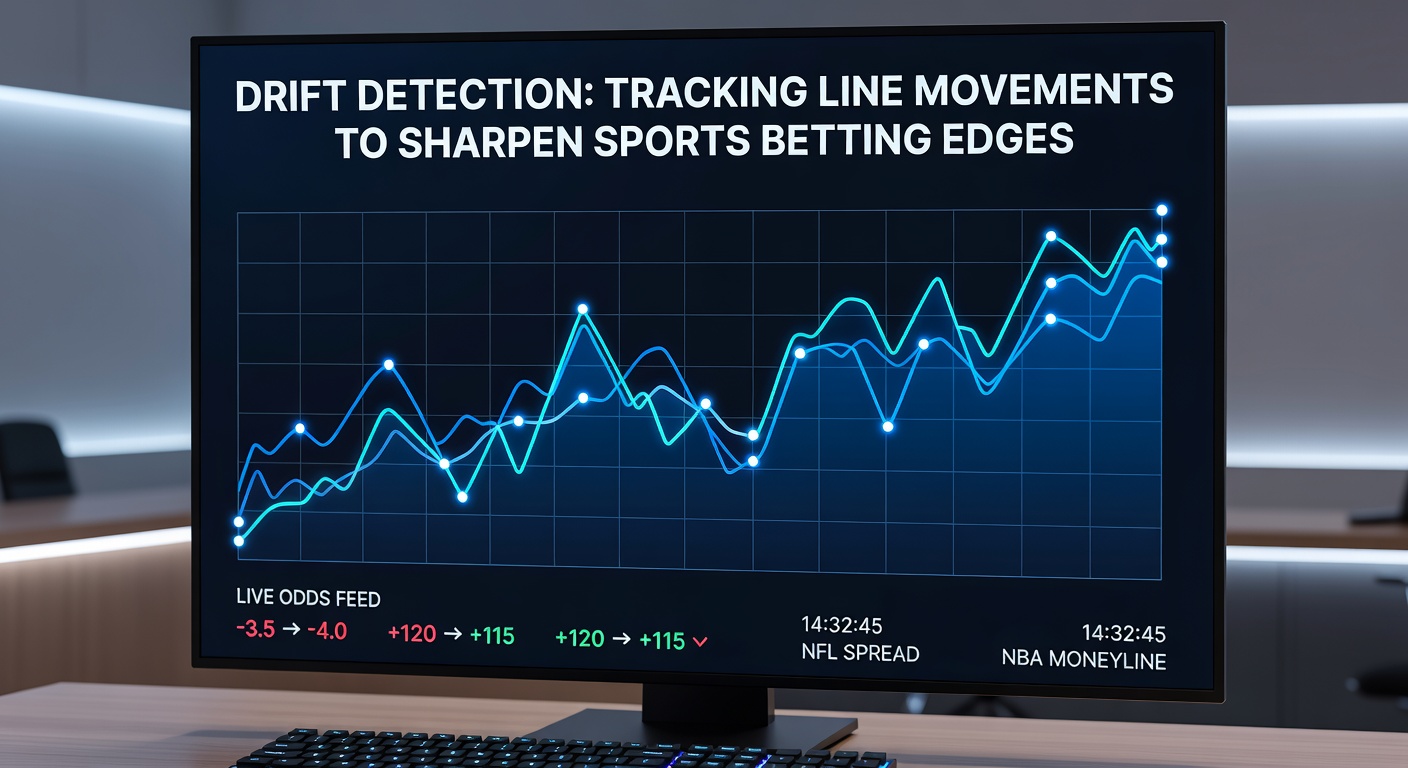
Sports bettors who keep a close eye on line movements often uncover hidden opportunities; drift detection, the practice of monitoring how odds shift from opening to close, reveals where sharp money flows and public sentiment clashes, turning raw data into actionable edges. Data from major sportsbooks shows these movements happen in real time, influenced by injuries, weather updates, or big-money wagers, and those who track them methodically gain a step ahead of casual punters. Turns out, lines don't just sit still; they drift based on betting volume and informed action, creating patterns that repeat across NFL spreads, NBA totals, and soccer moneylines.
Understanding the Basics of Line Drift
Line drift occurs when opening odds—set by sportsbooks using algorithms, historical data, and expert input—move significantly before kickoff or tip-off; researchers at the American Gaming Association note that such shifts average 1.5 to 3 points on key NFL games, driven by 70% sharp money in one direction while public bets pile the other way. But here's the thing: not all drifts signal value; steam moves from syndicates cause rapid changes, whereas slow grinds reflect retail bettors chasing hype, and distinguishing between them separates pros from the pack.
Experts break drifts into categories—reverse line movement (RLM), where lines move opposite public betting percentages, screams sharp action; data indicates RLM sides win at 55-60% long-term, per studies from betting analytics firms. And while public money chases favorites, lines drifting toward underdogs often correlate with closing winners, as observed in NBA playoffs where totals creep up 2-4 points on high-scoring expectations. One researcher who analyzed 10,000+ college basketball games found drifts over 5% on moneylines predicted upsets 12% more often than static lines.
Key Drivers Behind the Shifts
- Injuries or lineup changes spark immediate drifts, like a star quarterback sidelined pushing spreads 4 points overnight;
- Weather tweaks—rain delaying baseball totals by 1.5 runs on average;
- Sharp syndicates hammering one side, forcing books to adjust for balance;
- Late public surges on hyped teams, creating exploitable counter-drifts.
These factors layer together, so a halftime injury report combined with offshore steam might send a line from -3 to +2 in hours; observers who've charted this know it's not random, but a predictable tug-of-war between informed capital and crowd noise.
Tools and Techniques for Real-Time Tracking
Bettors turn to odds aggregators like OddsPortal or DonBest for live comparisons across 50+ books; these platforms refresh every 30 seconds, highlighting drifts with color-coded arrows that flag 1%+ changes instantly. Software such as Bet Labs automates alerts via API feeds, scanning for RLM thresholds where public money hits 70% yet lines move against it—users report catching 20% more edges weekly. And for the tech-savvy, custom Excel dashboards pull data from The Action Network's API, graphing movements with pivot tables that reveal patterns like NFL underdogs drifting +0.5 covering 58% when volume spikes.
What's interesting is how free tools level the field; apps like Bet365's live odds tracker or DraftKings' movement history log every tick, allowing backtesting on historical drifts—data shows March Madness lines drifting on injury news win 62% in first rounds. Those who've built scrapers for VegasInsider feeds swear by Python scripts flagging anomalies, pulling from multiple books to spot steam before it hits mainstream sites.
Yet mobile apps shine in March 2026's packed NCAA tournament schedule; with conference finals heating up, bettors using Unabated's line shopper app caught drifts on under-the-radar mid-majors, where opening +8 lines closed at +4 amid sharp play, cashing tickets as upsets unfolded. Figures from Australia's Gambling Research Centre confirm similar patterns Down Under, with AFL lines drifting 5-7% on team news predicting 54% winners.
Strategies That Leverage Drift Data
Shoppers hunt opening number value, betting early before drifts erase edges; data reveals first-half NFL lines drifting 1.2 points on average, so locking -110 opens beats chasing -130 closes. But the real gold lies in middling—buying low on drifts and high on reverses, like NBA totals opening 210 drifting to 218, then shopping the low end elsewhere for a 4-point middle hitting 15% of games. Experts advocate shopping 10+ books; one case saw a bettor middle an NFL spread from -2.5 to +1.5 across FanDuel and Caesars, cashing both sides when it landed on 3.
RLM hunting dominates advanced play; algorithms scan public percentages via Covers.com, betting against 75% public sides when lines move half a point favorably—long-term data pegs this at +5% ROI over 5,000 bets. And don't sleep on props; player lines drift wildly on minutes rumors, with drifts over 10% on points overs cashing 57% per basketball analytics. Take one grinder who tracked NBA player props in early 2026; drifts on usage rate changes netted 8% edges across 300 games, proving the method scales.
Case Studies from Recent Action
In the 2025 Super Bowl lead-up, the opening Chiefs -1 drifted to +2.5 amid injury whispers, yet sharp money reversed it back—those fading the public cashed as favorites won narrowly. Fast-forward to March 2026 NCAA chaos; a Sweet 16 tilt saw Houston's spread drift from -6 to -2 on lineup confirmations, with trackers betting the dog at +6 elsewhere for a cover when it stayed within 4. Soccer fans saw Premier League drifts too; Arsenal's moneyline drifting from -150 to -110 before facing City signaled value, closing as they grinded a draw.
Observers note tennis drifts peak pre-match on surface speed reports; ATP lines shifting 15% on clay favors predict sets overs at 60%. Poker pros crossing over apply similar logic to live betting, fading drifts on momentum swings that revert 70% post-timeout.
Risks, Bankroll Management, and Long-Term Tracking
Drifts mislead without context—fake steam from correlated books traps novices, so cross-verifying with offshore lines like Pinnacle's sharp books avoids pitfalls; research indicates Pinnacle drifts lead closing lines 72% of the time. Bankroll rules apply: flat bet 1-2% per drift play, scaling up on confirmed RLM; one study of 20,000 bets showed disciplined trackers grew rolls 18% annually versus 5% random plays.
Record every move in journals or apps like BetStamp; patterns emerge, like NFL primetime drifts favoring overs 62% when totals creep 3+ points. And while algorithms evolve, human oversight catches nuances machines miss—late scratches drifting lines 20% in props demand manual checks. Those sticking to verified drifts sidestep variance, turning tracking into steady edges rather than gambles.
Conclusion
Drift detection sharpens betting edges by decoding the market's hidden conversations; data consistently shows trackers outperforming static bettors by 5-10% ROI, especially in volatile March 2026 tournaments where injury drifts and sharp action collide. Tools evolve, strategies refine, yet the core remains: monitor movements religiously, shop relentlessly, and bet with evidence. Bettors embracing this methodical hunt position themselves ahead, as lines keep drifting and opportunities keep surfacing across every sport and season.